Disclosure: We’re reader-supported. When you buy through links on our site, we may earn a commission: Full Disclosure.
I got a call recently about microgreens. During the conversation, the person asked me about microgreens as a source of protein. I didn’t have an answer, so I went looking for one clean microgreens protein number.
I found two that could not both be right. One paper said about 30 percent, and another said 2 to 4. I checked both tables, and neither was wrong. They measured the same food on two different scales, and almost no one prints the scale beside the number.
That missing label is why this topic is so messy online. It is also why a number on a chart is not always the number on your plate. Here is what the papers show, with the scale named every time.
Key takeaway
Fresh microgreens hold about 1 to 4.4 grams of protein per 100 grams, yet one paper reports about 30 percent. Same food, two scales: the larger figure is dry weight, with the water removed (Punasiya et al., 2026; Ding et al., 2025; Ayeni, 2021). In one lab, fenugreek reached 4.42 g, broccoli 3.63 and lettuce 1.90.
Why can two correct studies land ten times apart? The answer is below, along with the crops that lead, what a real serving adds, and whether a microgreen beats its full-grown vegetable.
Check your protein number.
Per 100 g and per handful are different numbers. Ask Doc Green about your crop. The answer names its source, and he says so when the library has nothing on it.
No account needed. He can be wrong, and the source links sit under every answer.
How much protein is in microgreens?
This four-minute PBS clip with host Dr. Daphne Miller is a quick look at what microgreens are. The protein numbers in this post come from the papers, starting right here.
Measured fresh, the way you eat them, microgreens carry roughly 1 to 4.4 grams of protein per 100 grams. That range holds across four separate studies, on different crops, in different labs.
The tightest data comes from India. Punasiya and colleagues measured 16 crops in one lab, on fresh weight, and got 1.90 to 4.42 g per 100 g (Punasiya et al., 2026). A study of spinach, carrot, bathua, and Bengal gram microgreens found 2.4 to 3.4 percent (Sanyukta et al., 2023). Two more papers sit lower, around 1 to 2 percent (Mickky et al., 2026; Ding et al., 2025).
Then the dry-weight numbers show up, and they look nothing like these. Ayeni measured protein in tropical spinach and roselle micro and baby greens at 32.5 and 30 percent of dry weight (Ayeni, 2021). Same kind of food, different scale.
So when someone says microgreens are “30 percent protein,” ask one question: percent of what? Fresh weight is what you eat. Dry weight is what is left after the water is gone.
Why does one study say 3 percent and another say 30?
Water. In every paper that reported it, microgreens were 81 to 94 percent water, and that shapes every microgreens protein number you will see.
Dry the sample first, and the water leaves the math. A food that is 90 percent water has 10 grams of solids in every 100 grams. If 30 percent of those solids are protein, that is 3 grams of protein per 100 grams of the fresh food. That is my arithmetic, not a figure from a paper, and it lands inside the range the fresh-weight studies measured.
The test matters too. The India team measured protein with a modified Lowry assay, a color test: chemicals turn a deeper shade the more protein they meet, and the lab reads that shade. But it only counts protein that can be pulled out of the tissue (Punasiya et al., 2026).
Other papers followed AOAC procedures, the standard recipes food labs use, and each recipe has its own way of counting protein. So even when two papers both use fresh weight, their numbers will not match exactly.
Plant age changes the number as well. Ayeni followed tropical spinach and roselle from day 10 to day 20. Dry-weight protein fell from 35 to 27 percent in the spinach and from 35 to 22 percent in the roselle (Ayeni, 2021).
Then there is plain labeling. The 2023 ACS Omega paper never says whether its percentages are fresh or dry weight (Sanyukta et al., 2023). I read them as fresh because moisture sits in the same table, but the paper does not say.
Sometimes the wording outruns the table. A 2025 quinoa study calls its seedlings “an extraordinary source of plant protein.” Its selected lines measured 1.01 and 1.68 percent protein. The authors describe that as slightly lower than spinach (Ding et al., 2025). Read the table before you read the headline.
Which microgreens have the most protein?
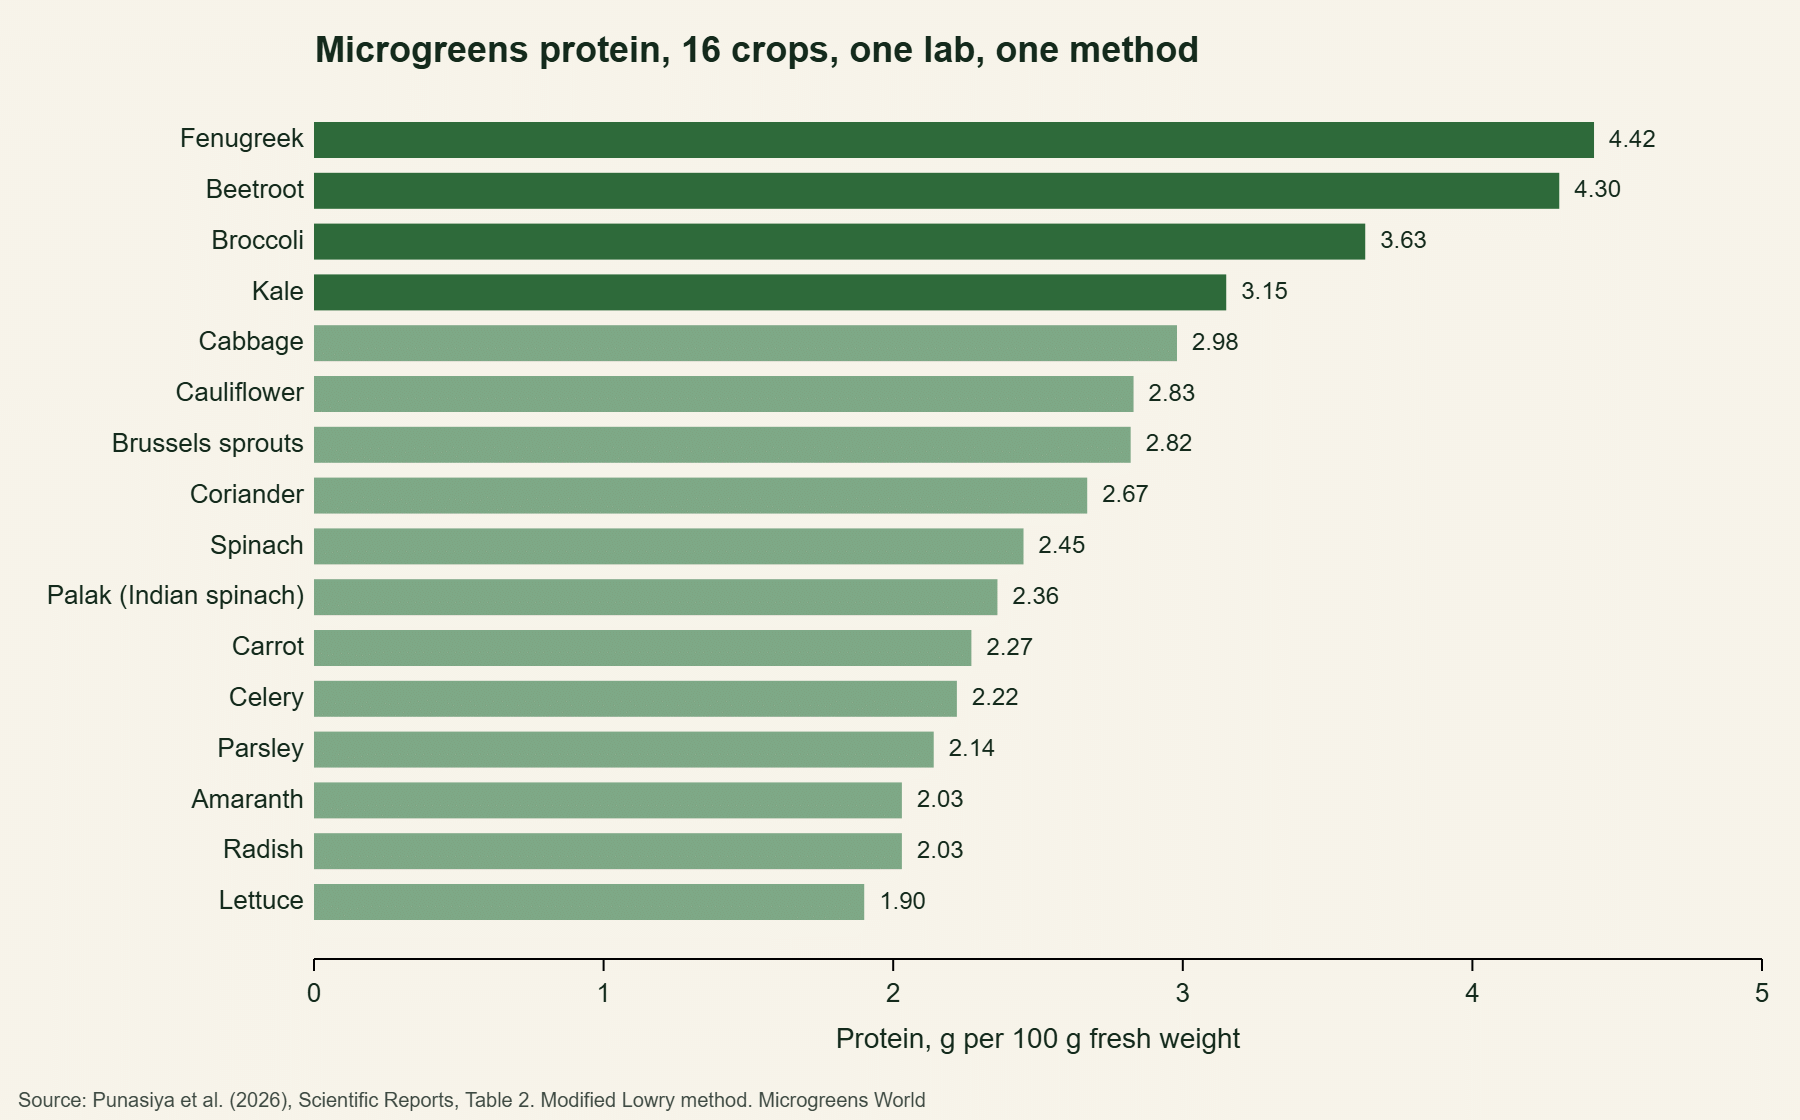
If you want a microgreens protein ranking, the cleanest one comes from a single lab. Punasiya and colleagues tested 16 crops with one method, on fresh weight, so the crops can be compared with each other (Punasiya et al., 2026).
Fenugreek led at 4.42 g per 100 g, then beetroot at 4.30, broccoli at 3.63, and kale at 3.15. At the bottom, lettuce measured 1.90, with radish and amaranth both at 2.03.
The middle is tightly bunched. Cabbage, cauliflower, Brussels sprouts, coriander, and spinach all fall between 2.4 and 3.0 g. From top to bottom, the spread is a little more than double.
Two limits are worth saying out loud. This is one study in one lab, so another seed lot or harvest day could shift every value. And sunflower and pea, the two crops people ask about most, were not in it. For sunflower, the sunflower microgreens nutrition page covers what the research shows.
Are microgreens a good source of protein?
On the evidence, microgreens protein is a small contribution to a day, not a main source. The Indian authors call microgreens “fair sources” of protein, and their own serving math shows why.
They used an 85 g serving, the US reference amount for labeling. At that size, protein comes to 3.2 to 7.5 percent of the 50 g Daily Value (Punasiya et al., 2026). Scaled from their table, that is about 1.6 g for lettuce, 3.1 g for broccoli, and 3.8 g for fenugreek. The grams are my arithmetic.
The authors also note that real intake may be lower than 85 g, and most people do eat less than that in one sitting. The serving calculator on our Health Hub starts at 20 g. At that size, the same arithmetic gives roughly 0.4 g for lettuce, 0.7 g for broccoli, and 0.9 g for fenugreek.
What that means for your day is a question for you and your clinician. This post reports what was measured. It does not say how much protein you should eat, and none of these papers tested microgreens against a health goal.
Do microgreens have more protein than full-grown vegetables?
Sometimes. The clearest test of protein in microgreens against grown plants is one study, so read it that way.
Ayeni compared young and mature leaves of two crops. Tropical spinach micro and baby greens measured 32.5 percent protein on dry weight, against 25 percent in mature field-grown plants. Roselle measured 30 percent against 22 percent (Ayeni, 2021).
Two things to hold onto. Those are dry-weight figures, so they compare the solids and not the amount on a plate. And it is two crops at one site. The paper notes that other work found similar levels in amaranth, but one lab’s pair of crops is not a rule for every microgreen.
A fair reading: in these two crops, the young plant held more protein per gram of solids than the mature one. That is a reason to keep testing, not a rule.
Wrap-up: how much protein do microgreens give you?
Microgreens protein comes down to scale. On the fresh weight you eat, the papers land between about 1 and 4.4 g per 100 g, and one lab ranked 16 crops with fenugreek and beetroot on top. On a dry basis, the same kind of food reads near 30 percent. Neither number is wrong, but only one describes your plate.
Protein is one piece of a larger picture. To see where it fits next to everything else microgreens carry, the Health Hub is the place to start. If you want the papers themselves, the research database lets you search them by crop, nutrient, or author.
This information is educational and is not a substitute for professional medical advice. Talk with your physician before making significant changes to your diet or before using microgreens to address a health concern.
Check your protein number.
Per 100 g and per handful are different numbers. Ask Doc Green about your crop. The answer names its source, and he says so when the library has nothing on it.
No account needed. He can be wrong, and the source links sit under every answer.
Microgreens protein: frequently asked questions
How much protein is in sunflower microgreens?
One 2026 study measured 1.66 percent total protein in untreated sunflower microgreens (Mickky et al., 2026). Moisture in those samples ran above 90 percent, which points to a fresh-weight figure. That is about 1.7 g per 100 g, so a small serving adds well under a gram.
Can salt stress raise the protein in microgreens?
In one study, yes. Trays watered with 25 mM sodium chloride made 27.6 percent more total protein than untreated ones (Mickky et al., 2026). It was a single crop under lab conditions, so it is a finding about plant stress and not a growing tip.
References
Ayeni, A. (2021). Nutrient content of micro/baby-green and field-grown mature foliage of tropical spinach (Amaranthus sp.) and roselle (Hibiscus sabdariffa L.). Foods, 10(11), 2546. https://doi.org/10.3390/foods10112546
Ding, P., Wang, R., Noor, H., Chen, Q., Ji, B., Tao, J., Yan, X., Li, X., Lv, H., Wu, X., Sun, M., & Gao, Z. (2025). Comparative profiling of 72 quinoa varieties reveals superior nutritional quality, bio-active phytochemicals, and sensory acceptability for functional leafy vegetable applications. BMC Plant Biology, 26, 80. https://doi.org/10.1186/s12870-025-07779-x
Mickky, B., Shams Eldeen, R., & Elnajar, M. (2026). Salt eustress modulates physiological responses and enhances yield, nutritional quality, and antioxidant capacity in sunflower microgreens. BMC Plant Biology, 26(1), 1483. https://doi.org/10.1186/s12870-026-09786-y
Punasiya, M., Singh, H., Panda, A., Pradhan, J., & Agnihotri, R. (2026). Nutritional profiling and nutrient quality scoring of microgreens cultivated in India. Scientific Reports. https://doi.org/10.1038/s41598-026-75504-1
Sanyukta, Brar, D. S., Pant, K., Kaur, S., Nanda, V., Nayik, G. A., Ramniwas, S., Rasane, P., & Ercisli, S. (2023). Comprehensive analysis of physicochemical, functional, thermal, and morphological properties of microgreens from different botanical sources. ACS Omega, 8(32), 29558–29567. https://doi.org/10.1021/acsomega.3c03429